Personal Fitbit Data Analysis in Python

I analyzed my personal fitbit activity data, and compared it with activity data from a fitbit activity dataset from Kaggle.
The results were interesting to observe and have helped me better understand my activity levels. These insights were significant to me because I want to be more active, and this data has given me insights on how my activity compares to 30 other Kaggle users.
Overview
Software: Python, CSV files
Skills: Appending multiple CSV files together using Python, Data Visualization and Data Analysis with Python
Disclaimer: This data analysis is based on a very limited set of data points (for both my data and the Kaggle data) and will be difficult to generalize.
Why did I want to analyze my fitbit data?
Towards the end of 2023 I wanted to start increasing my step count per day, and working toward starting to improve my overall health. Due to having a desk job, I am not able to walk much during the day yet the times that I have been able to walk for longer lengths of time, my mood has improved greatly. My dog has also greatly enjoyed longer walks.
Walking is good for our health, and I wanted to review my steps data from the past year to see trends and patterns in my activity levels. Through doing so, I realized looking at my information in a silo does not help me know how to improve my overall health.
Therefore, this project is split into two parts. The first part will include an evaluation of my personal health data. The second part will include my personal health data compared to a fitbit dataset from Kaggle with user activity information from 30 users over the course of 30 days.
Part 1 - My Fitbit Activity Data for 2023
Before Looking at my data I was curious to find out…
- What day had the most amount of steps in 2023?
- How did my activity change on weekday’s vs. weekends?
- What days during the week am I most active?
- Is there a correlation between the step count and calories burned?
First I found these interesting metrics: Total Steps in 2023
1,944,479
Most Steps in a Day
May 20, 2023
19,674
Extracting the Raw Data from Fitbit
There are two ways to download fitbit data. You can export all of your data throughout the entire time you have used fitbit by clicking on export on Fitbit’s website when logged in.

Or you can download a selection of data for a time period of no more than 30 days.

At first I tried to download all of the data ever stored on my account through the fitbit website, which downloaded into a zipped folder. The problem was the data I wanted to dive into was in json files.
I decided to approach this data extraction with the second option since I knew CSV’s would be easier for me to work with. I decided to download all of my steps/activity data for each month of 2023 into their own individual csv files.
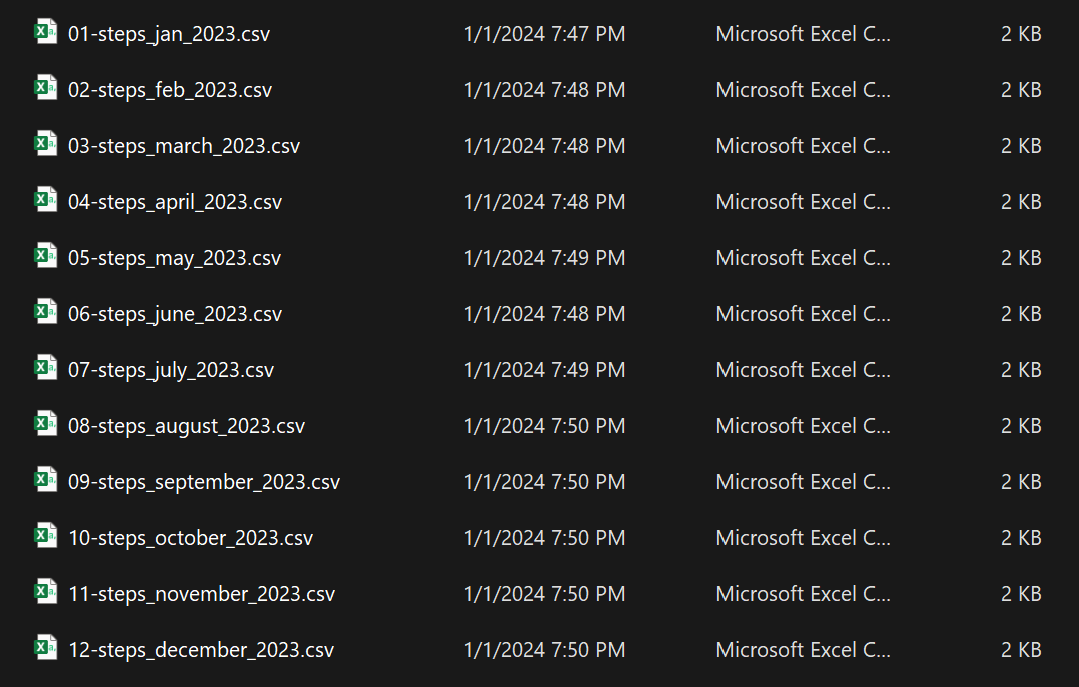
Then I combined the CSV files into one file for the entire year using Python.
1
2
3
4
5
6
7
8
9
10
11
12
13
14
import os
import glob
import pandas as pd
os.chdir("C:/Users/annet/Documents/Steps-Data-2023")


extension = 'csv'
all_filenames = [i for i in glob.glob('*.{}'.format(extension))]


#combine all files in the list
combined_csv = pd.concat([pd.read_csv(f) for f in all_filenames ])
#export to csv
combined_csv.to_csv( "combined_csv_4.csv", index=False)
At first this didn’t work due to the top header listed as Activity when downloading all fitbit data. This is why my CSV title is “combined_csv_4.csv” since it took me three tries to determine why it wasn’t working, and I succeeded with a solution on the fourth try.
The csv’s were trying to combine the data with the first row, which only had “Activity” listed in it, which was the header for each individual CSV I downloaded since I only downloaded Activity data.
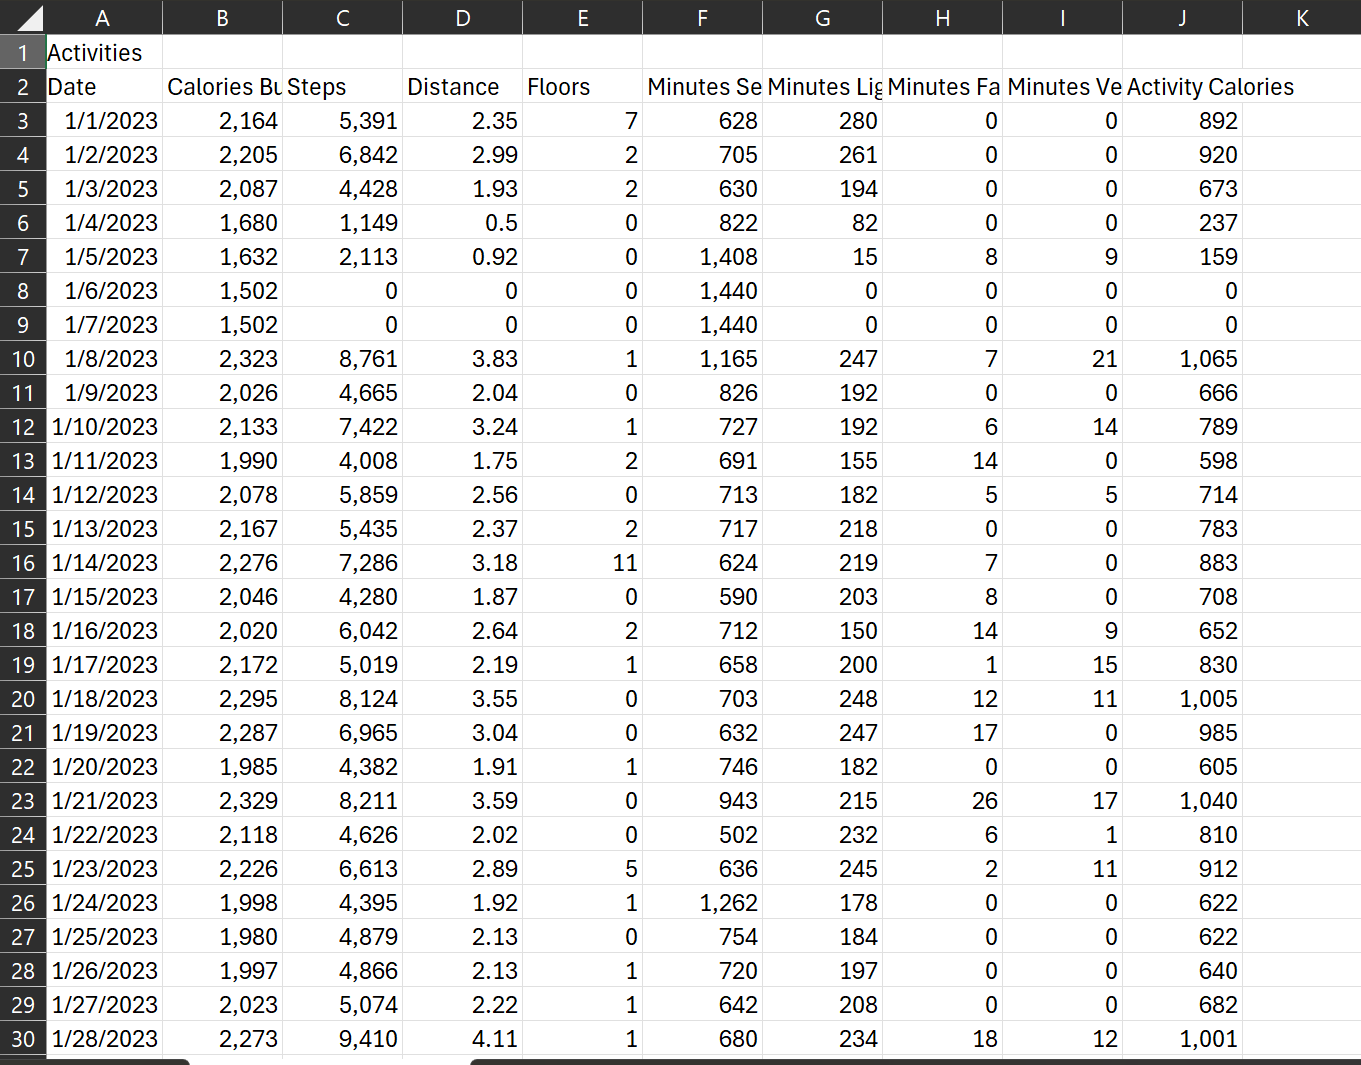
I deleted all the rows with the “Activity” header and then ran this script again, leading to the correct appending of all the rows under all the correct columns.
I verified this by looking at the amount of rows, and since there are 365 days in a year, and I had a header row, the 366 rows for my appended spreadsheet was now correct, with all of the data together.
Once I removed the “Activity” Header, all the data appeneded to the correct columns.
Data Verification in Python
Reading the file, and taking a look at the first few rows
1
2
3
4
5
6
7
8
import pandas as pd
import numpy as np
import matplotlib.pyplot as plt
from pandas.api.types import CategoricalDtype

daily_activity = pd.read_csv('C:/Users/annet/OneDrive/Documents/Portfolio/Fitbit-Data-Project/Steps-Data-2023/combined_csv_all_dates_2023.csv')

daily_activity.head()
1
2
3
4
5
6
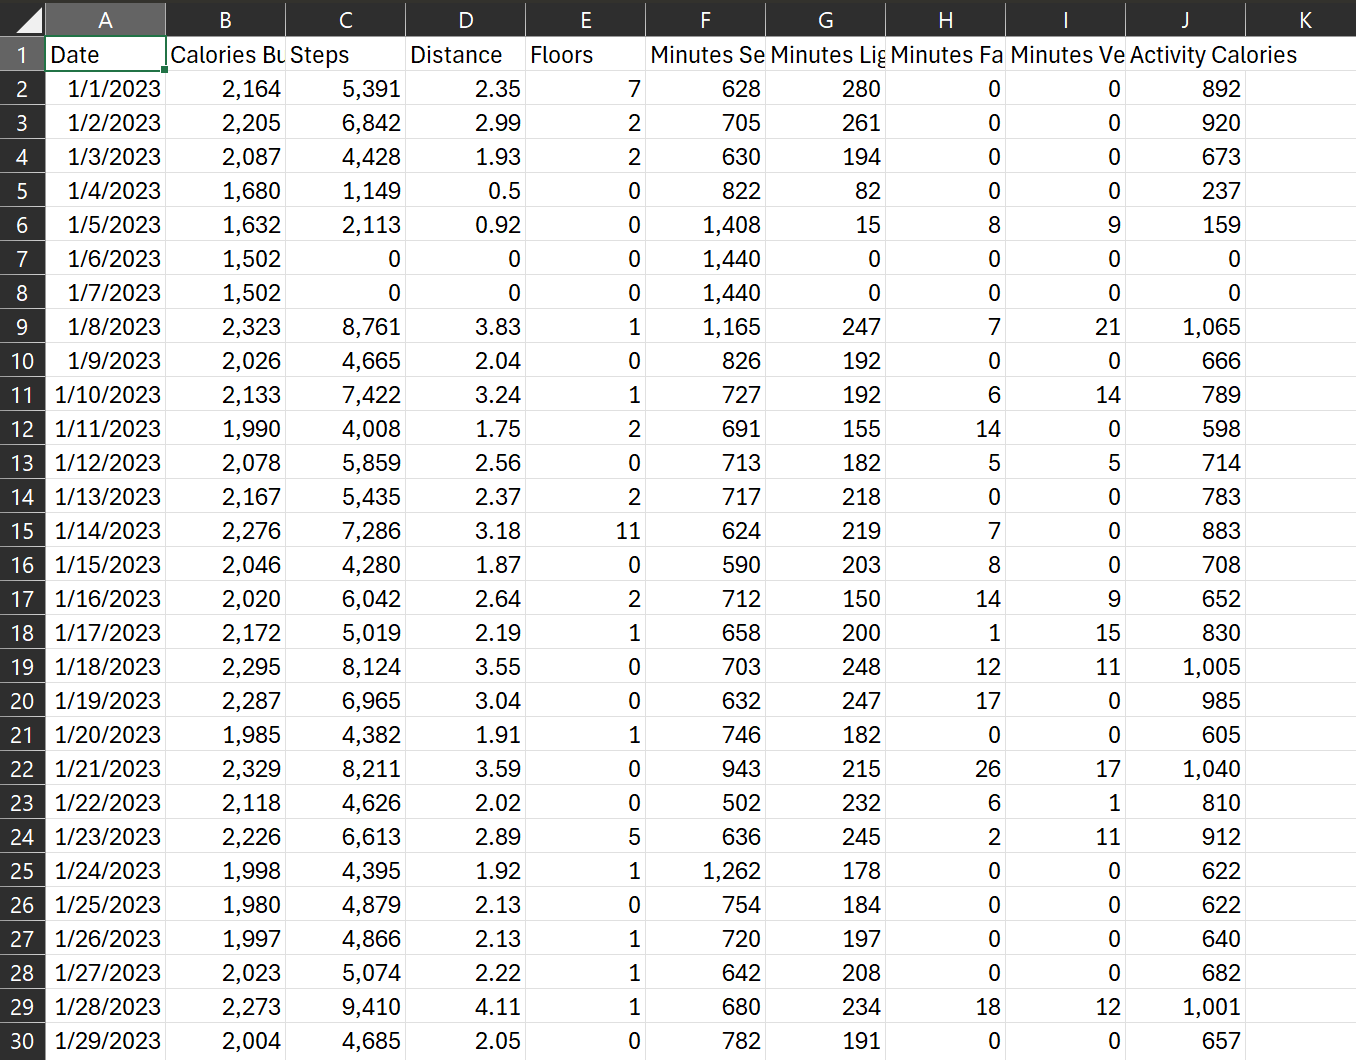
Date Calories Burned Steps Distance Floors Minutes Sedentary Minutes Lightly Active Minutes Fairly Active Minutes Very Active Activity Calories
0 1/1/2023 2164 5391 2.35 7 628 280 0 0 892
1 1/2/2023 2205 6842 2.99 2 705 261 0 0 920
2 1/3/2023 2087 4428 1.93 2 630 194 0 0 673
3 1/4/2023 1680 1149 0.50 0 822 82 0 0 237
4 1/5/2023 1632 2113 0.92 0 1408 15 8 9 159
Verifying Data Types
1
daily_activity.dtypes
Date                       object
Calories Burned             int64
Steps                       int64
Distance                  float64
Floors                      int64
Minutes Sedentary           int64
Minutes Lightly Active      int64
Minutes Fairly Active       int64
Minutes Very Active         int64
Activity Calories          object
dtype: object
Verifying the amount of unique dates in the fitbit data file matches how many days are in a year
1
daily_activity.Date.nunique()
365
Exploring the shape of the dataset
1
daily_activity.shape
(365, 10)
Describing the dataset
1
daily_activity.describe()
Are there any null values?
1
daily_activity.isnull().any()
Date                      False
Calories Burned           False
Steps                     False
Distance                  False
Floors                    False
Minutes Sedentary         False
Minutes Lightly Active    False
Minutes Fairly Active     False
Minutes Very Active       False
Activity Calories         False
dtype: bool
Are there any duplicated values?
1
daily_activity.duplicated()
0      False
1      False
2      False
3      False
4      False
       ...
360    False
361    False
362    False
363    False
364    False
Length: 365, dtype: bool
###
1
daily_activity['Date'] = pd.to_datetime(daily_activity.Date, format='%m/%d/%Y')
Add a column for Day of the Week
1
daily_activity['DayOfWeek'] = daily_activity['Date'].dt.day_name()
Preview the Day of the Week additional column
1
daily_activity.head()
Find the Mean, Min, and Max for Steps and Calories
1
2
3
4
daily_activity.agg(
    {'Steps': ['mean', 'min', 'max'],
     'Calories Burned': ['mean', 'min', 'max'],
    })
Steps	Calories Burned
mean	5327.339726	2073.6
min	0.000000	1499.0
max	19674.000000	3726.0
Plot the coorelation between Steps and Calories Burned
1
2
3
daily_activity.plot.scatter(x='Steps', y='Calories Burned', color='purple', alpha=0.5, figsize=(10,5))
plt.title('Total Steps x Calories')
plt.show()
Insight: The scatterplot shows that there a strong positive coorelation between steps and calories burned
Show the average number of steps by day of the week
1
2
3
4
5
cats = ['Sunday', 'Monday', 'Tuesday', 'Wednesday', 'Thursday', 'Friday', 'Saturday']
cat_type = CategoricalDtype(categories=cats, ordered=True)
daily_activity['DayOfWeek'] = daily_activity['DayOfWeek'].astype(cat_type)
df_weekday = daily_activity.copy().groupby(daily_activity['DayOfWeek']).mean(numeric_only=True).reindex(cats)
df_weekday.filter(['Steps'])
Plot the average number of steps per day of the week
1
2
df_weekday['Steps'].plot.bar(xlabel='Day of the Week', ylabel='Average of Total Steps', title='Average of Total Steps by Day of Week', color='purple', legend=False, rot=0, figsize=(10,5))
plt.show()
Show the Mean, Min, and Max of Active and Sedentary Minutes
1
2
3
4
5
6
daily_activity.agg(
    {'Minutes Very Active': ['mean', 'min', 'max'],
     'Minutes Fairly Active': ['mean', 'min', 'max'],
     'Minutes Lightly Active': ['mean', 'min', 'max'],
     'Minutes Sedentary': ['mean', 'min', 'max'],
    })
Plot the Active and Sedentary Minutes
1
2
3
4
5
colors = ['#4F6272', '#B7C3F3', '#DD7596', '#8EB897']

minutes_categories = daily_activity[['Minutes Very Active', 'Minutes Fairly Active', 'Minutes Lightly Active', 'Minutes Sedentary']].mean()
minutes_categories.plot.pie(ylabel='Category', title='Average of Minutes Spent in Each Activity Category', autopct='%1.0f%%', colors=colors, fontsize='11', startangle=0, figsize=(10,8))
plt.show()